Cannes Lions
Babiloo - The innovative Dashboard for the Brands' Digital Ecosystems
HALLELUJAH, Milan / DIGITAL + / 2016

Overview
Entries
Credits
Overview
Description
DATA INSIGHTS
Social media are nowadays a powerful source of insights but at the same time a potentially huge "Tower of Babel" with too much information in it. Moreover, data achieve strongest meaning and value once they connect with each other allowing a wider-but-unified reading angle.
INNOVATION
Babiloo innovative approach is rooted on 3 pillars:
1) innovative form of visual representation of data, easy to grasp and immediate to read and navigate.
2) Aggregation of data from multiple data sources and visual representation in selected and aggregating measurements.
3) proprietary metrics developed on the basis of long standing experience in data analysis and communication development in digital and social media fields.
ORIGINALITY
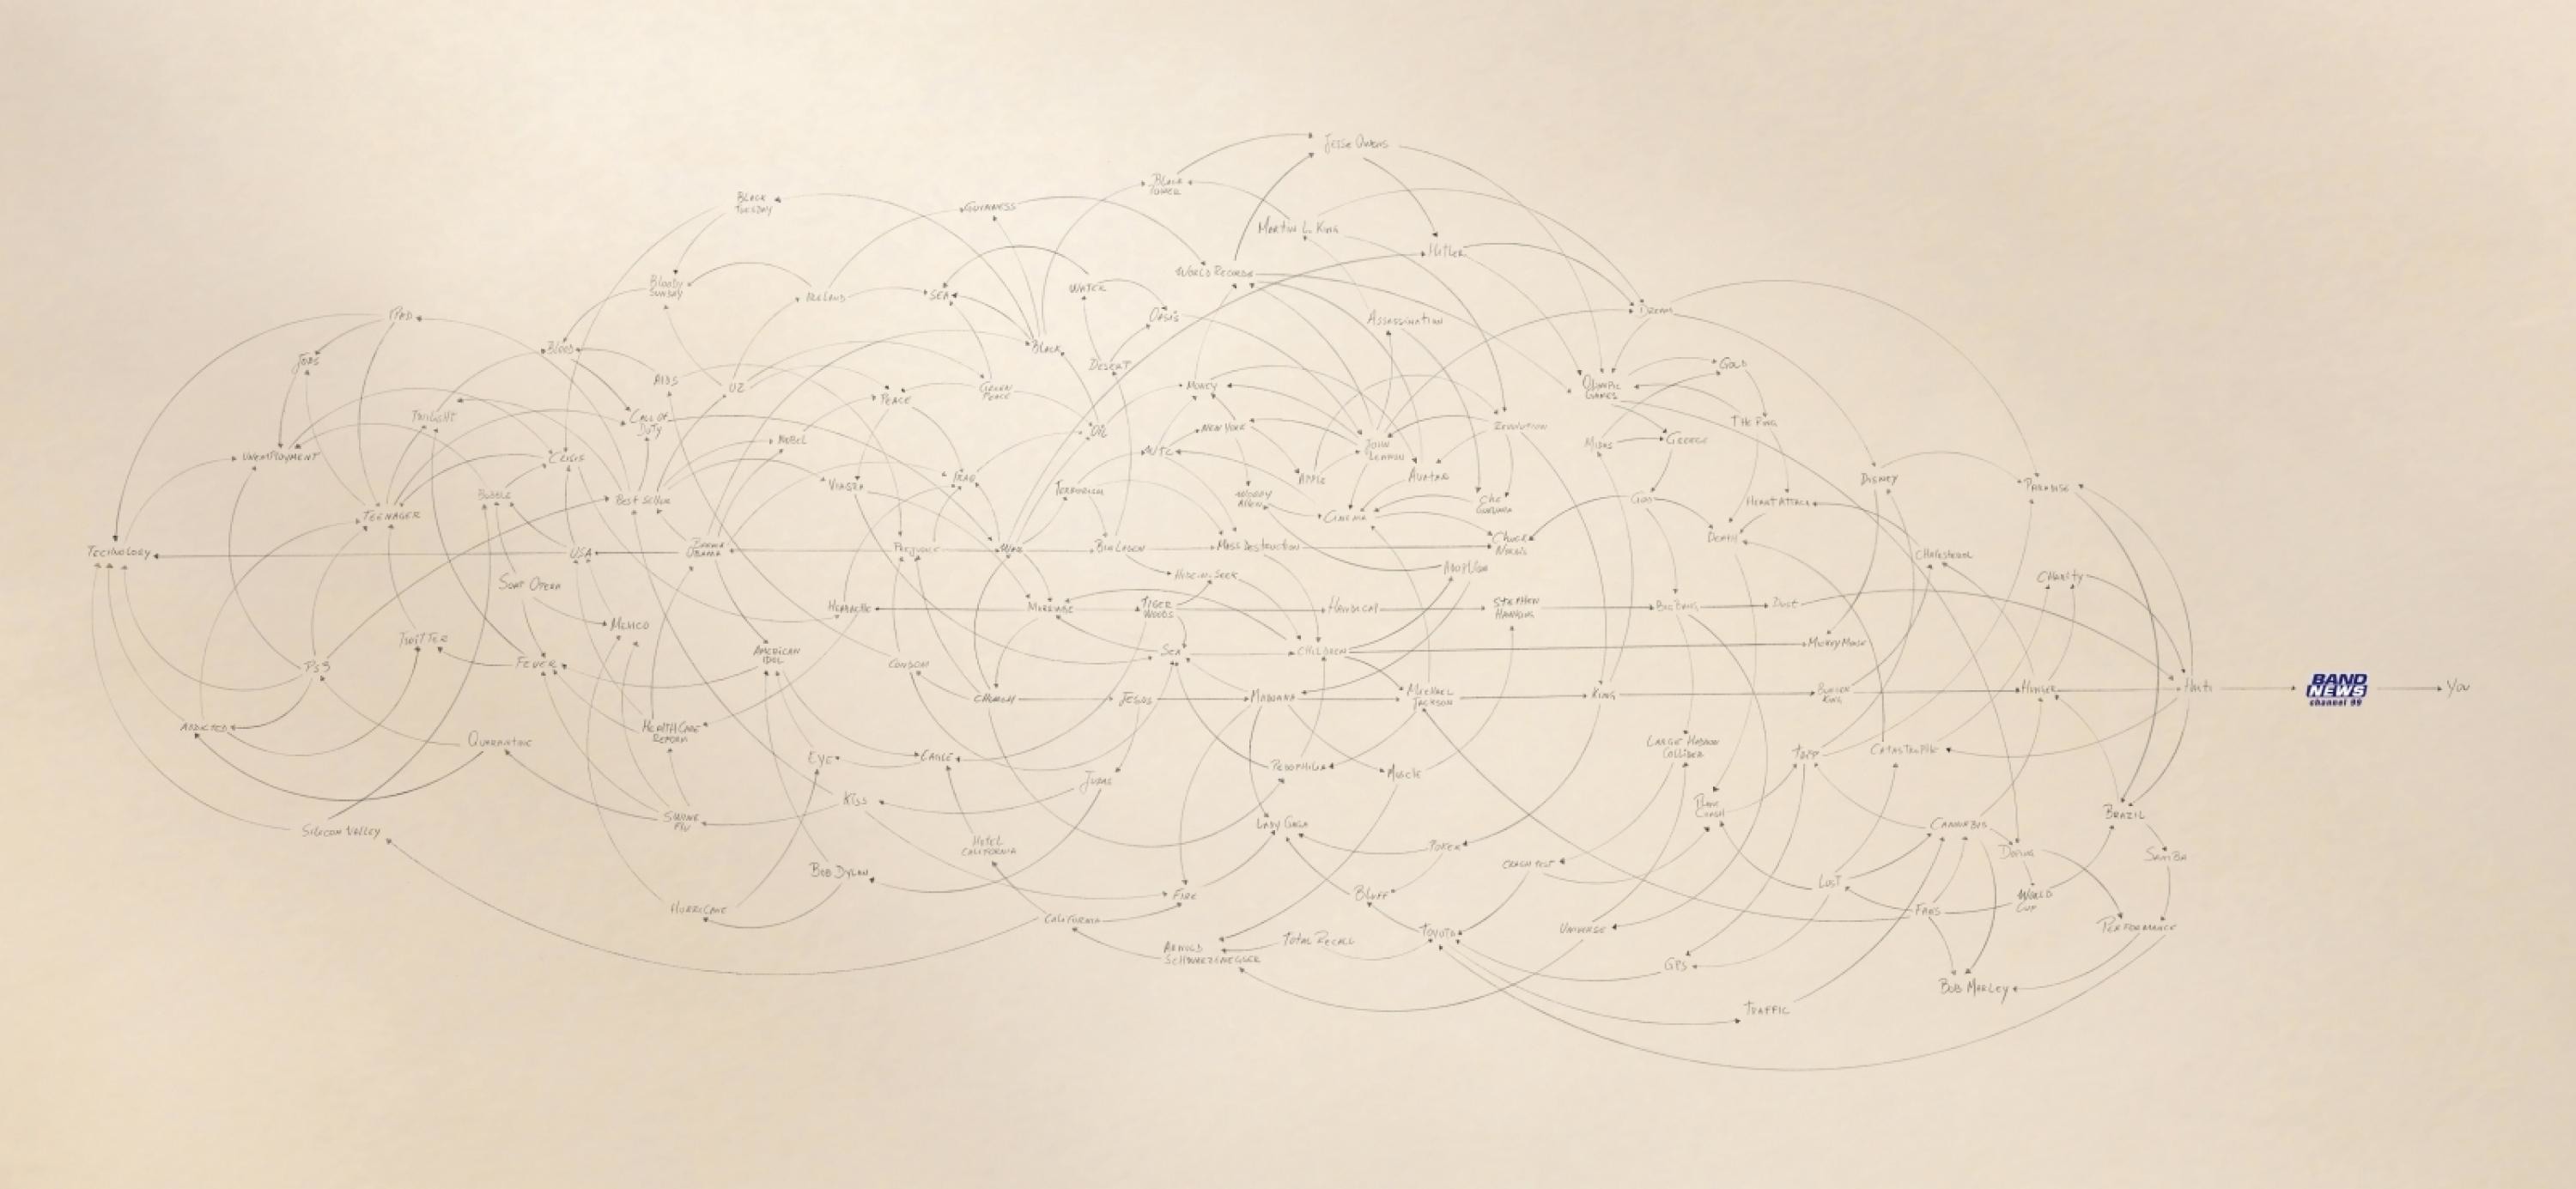
Babiloo converts all data in the ecosystem we are most familiar with: planet earth. Rather than graphs and bars, the whole ecosystem is first presented in its entirety as the brand planet. Each element of the planet, grounds, tides, clouds, sun, identifies a specific key performance indicator aggregating all data from all sources in 1 single number.
Execution
The aim behind Babiloo was to develop an innovative dashboard with an immediate to understand and friendly interface, that allows effective decision makings and actionable communication insights not only for data analysts.
Objectives set were the following:
1)design of effective visual interface;
2) representation of the whole brand digital ecosystem: brand social channels + websites and mobile apps.
3) effective data aggregation in limited but meaningful number of overall key metrics.
4) access to further digging and exploration in order to tell a better brand story.
Babiloo innovative approach is rooted on 3 pillars:
1) innovative form of visual representation of data, easy to grasp and immediate to read and navigate.
2) Aggregation of data from multiple data sources and visual representation in selected and aggregating measurements.
3) proprietary metrics developed on the basis of long standing experience in data analysis and communication development in digital and social media fields.
Babiloo converts all data in the ecosystem we are most familiar with: planet earth. Rather than graphs and bars, the whole ecosystem is first presented in its entirety as the brand planet. Each element of the planet, grounds, tides, clouds, sun, identifies a specific key performance indicator aggregating all data from all sources in 1 single number.
Data integration and brand storytelling happen through the aggregation at a primary level into 4 key metrics, reflecting the elements of planet earth: ground for population; tides for reach; clouds for interactions; sun for competitive index; spaceman for most active users/influencers.
The visual representation of these 4 elements, in terms of size is the actual reflection of the significance of each number. Further analysis of the data is then accompanied by a drill-down page allowing analysis of each social network and data breakdown for relevant features.
Outcome
From now on, brand decision makers who are not necessarily data-savy nor expert data analysts and technical at using dashboard tools, will be able to grasp in first person the benefit of an all encompassing view of their brand digital ecosystem and connect the dots among different platforms and different activities executed by the brand.
A short term view paired with the long term vision delivered by the tracking of so many different data sources, to be able to tell a proper and meaningful brand story unfolded over time.
a new approach to data visualisation that brings complicated numers and indicators directly into the boardrooms for easy grasp and backed-up decisions.
Similar Campaigns
12 items