Creative Data > Creative Data
SMALLPOX SIMULATION SPREAD TOOL
WUNDERMAN THOMPSON HEALTH, Washington / TECOVIRIMAT SIGA / 2022

Overview
Credits
OVERVIEW
Why is this work relevant for Creative Data?
Data is at the heart of the idea.
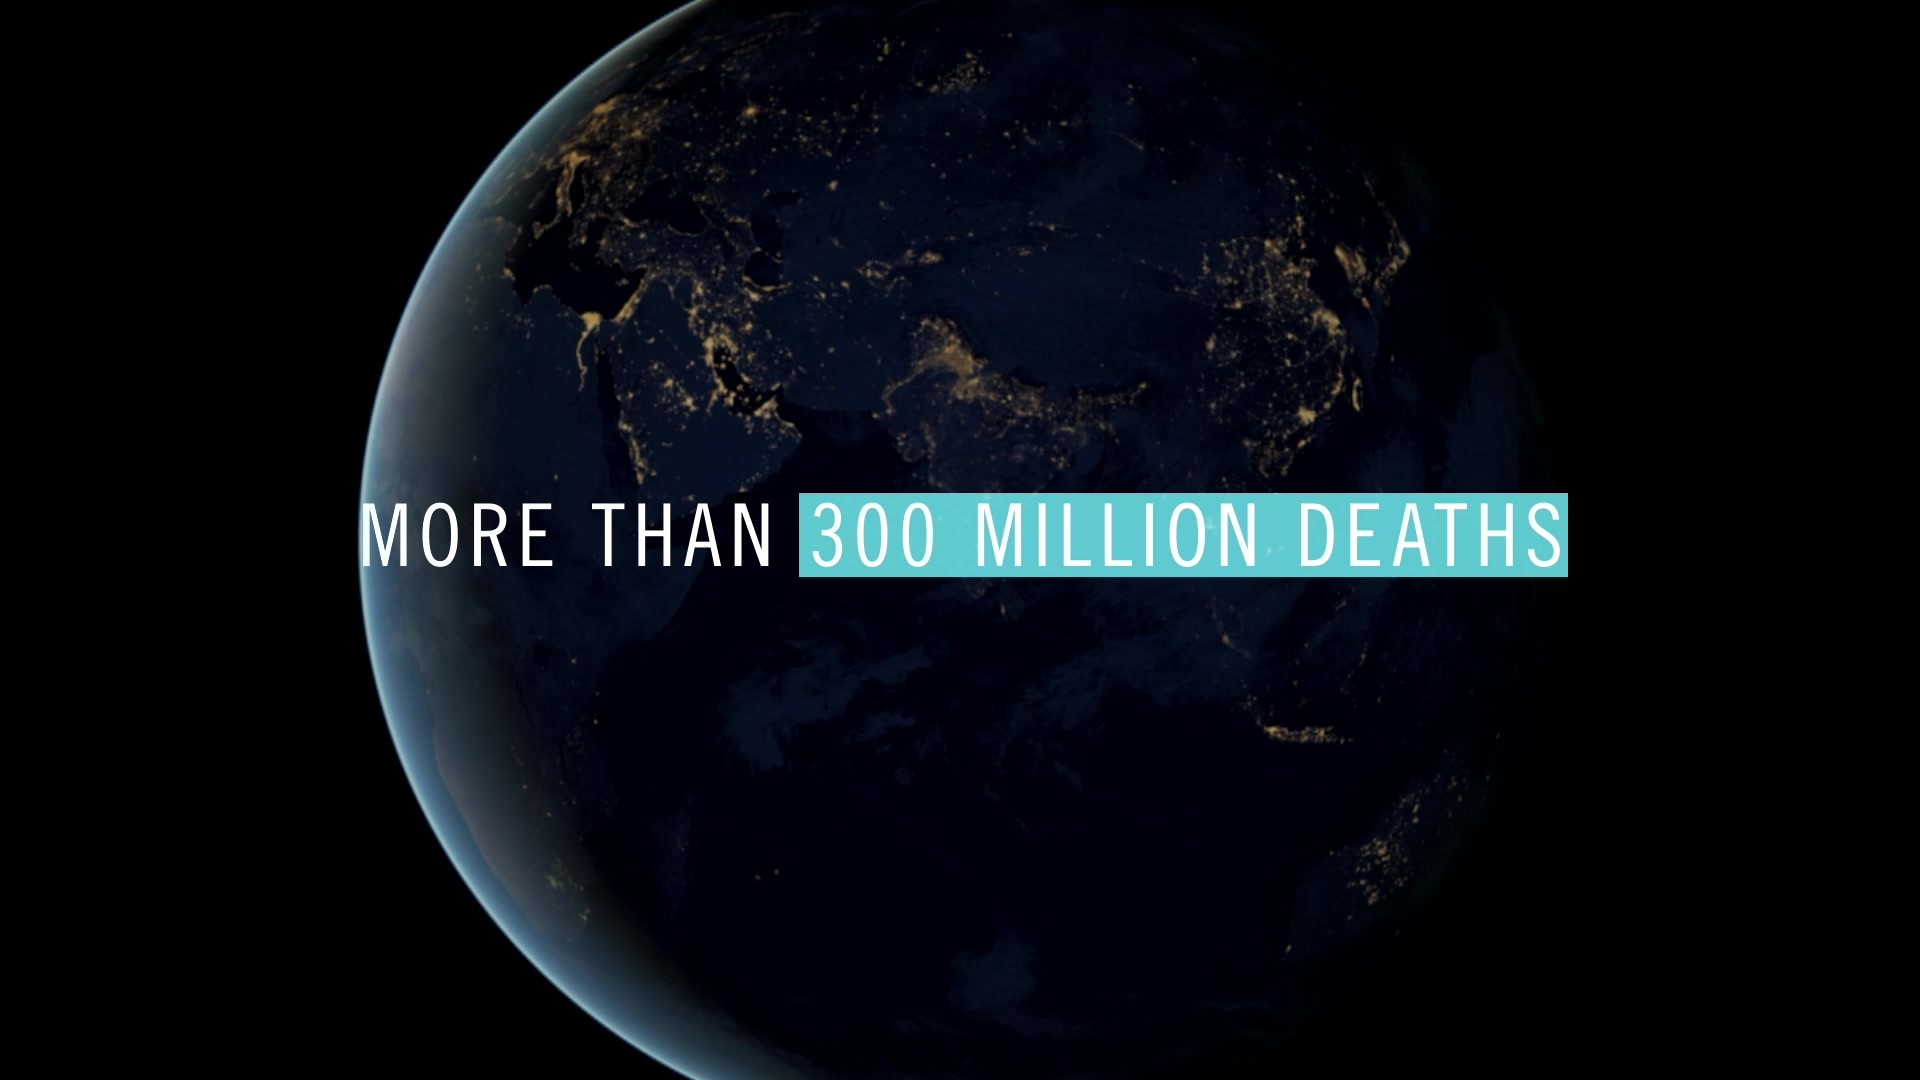
Modern audiences have no recent memory of smallpox. Our understanding of it is based on historical data. The Simulator applies historical data to modern conditions so users can visualize the impact smallpox could possibly have today. Using data visualization, the Simulator shows 1) rapid spread of infections, death, etc, 2) impact on individual countries, 3) potential shortfalls of current mitigations (vaccines, quarantine), and 4) COVID-19’s GDP impact, for context. Data sources included an SEIR model to estimate impact of infectious diseases, a Markov model, census data, and relevant COVID-19 data.
Background
Eradicated in 1980, smallpox has re-emerged as a modern threat. Highly contagious, it has a mortality rate of 30%. Intelligence communities have warned of smallpox being leveraged as a bioweapon.
Most countries have vaccine stockpiles as their main mitigation, but between logistical complications and a limited window in which infected people can be vaccinated, their main countermeasure may not be enough to contain an outbreak.
We had to drive understanding of the modern threat of smallpox and its impact to educate ministries of health and defense on the need to invest in a more comprehensive response plan, as vaccines alone may not be enough to contain the virus.
Government officials across ministries of public health and defense may not think of smallpox as a current threat compared to other more looming present threats. And even if they did, they feel prepared due to their vaccine stockpiles.
Describe the creative idea / data solution
How do you illustrate the potential threat of a weaponized strain of a disease that has been eradicated for 40 years? We brought the data to life through the Smallpox Simulator: a digital tool that leverages epidemiological literature on previous smallpox outbreaks, scientific literature on modeling the spread and casualties of infectious diseases, and data visualization technology to animate a smallpox outbreak in various countries.
We started with a 2001 CDC mathematical model to show the effect of mitigations on a smallpox outbreak. We then incorporated other data sources to contextualize the outputs and make them relevant.
The Smallpox Simulator accomplished 2 main objectives: 1) it showed officials what could happen in their home country, and 2) it showed that vaccines alone might not be enough to contain the early spread of disease.
Describe the data driven strategy
We needed a data strategy to prepare governments for the potential of a man-made smallpox outbreak in a way that was both credible and viscerally compelling.
To be credible, we modernized a 20-year-old CDC research paper into a contemporary Python data model to predict the deadly impact that releasing the disease would have in today’s environment. This required incorporating new elements and issues commonplace in a post-pandemic world, like social distancing, into the original model, which never envisioned COVID-19.
To be compelling, we animated a smallpox outbreak over 120 days across 9 countries using a GeoJSON-driven map interface. The data visualizations illustrate how quickly hospitals are overwhelmed, infections spread, and deaths accumulate, eliminating any doubt about the dangers of smallpox.
We chose 120 days to show the rapid impact smallpox could have before vaccines could be fully deployed. Country-specific results showed officials how smallpox might spread across their nation.
Describe the creative use of data, or how the data enhanced the creative output
Our creative use of data was developing a modeled visualization of an unimaginable scenario. We recreated a 20-year-old Markov chain model to describe the spread of smallpox through a highly susceptible population. The model was originally built in Excel 97 by CDC authors in 2002 and had no codebase or data sets available.
We creatively and credibly translated the methods described in the paper into Python code. We implemented a time-dependent Markov chain with 37 distinct possible states, one for each day of each disease stage. We also assigned each day a distinct probability of moving to Day 1 of the next stage of the disease or staying in the current stage for another day.
This model enabled a series of real-time data animations and visualizations that demonstrated to decision makers—viscerally and irrefutably— the potential risks of being underprepared in the event of a biological attack involving smallpox.
List the data driven results
The multi-tier visual representation helped remove barriers to understanding the challenge, demonstrating the full extent of the problem across numerous metrics, and showcased the need for a more comprehensive plan in the event of a weaponized smallpox release.
The Simulator drove urgency in understanding the impact of smallpox in a way that prompted follow-up conversations about how to build and invest in a more robust response plan.
The Smallpox Simulator elevated Meridian’s brand perception at industry functions and provided an innovative yet intimate sales experience backed by data, technology, and cohesive creative. The Simulation helped facilitate and enhance conversations with decision makers, across 9 countries, who are responsible for the health and safety of almost 350 million people across Europe, Asia, and the Middle East.
More Entries from Data Integration in Creative Data
24 items

More Entries from WUNDERMAN THOMPSON HEALTH
24 items